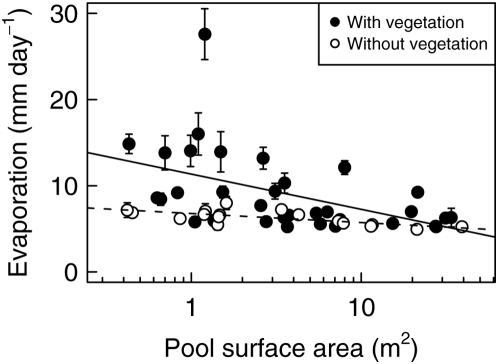
Figure 2. Observed evaporation rates.
Mean (±SE) daily evaporation in 50 pools at 23 time intervals in summer 2006. Each interval was 24 hours long. Evaporation correlated significantly negatively with pool surface area and was significantly higher in pools with vegetation compared to pools without vegetation (straight line versus dashed line).

