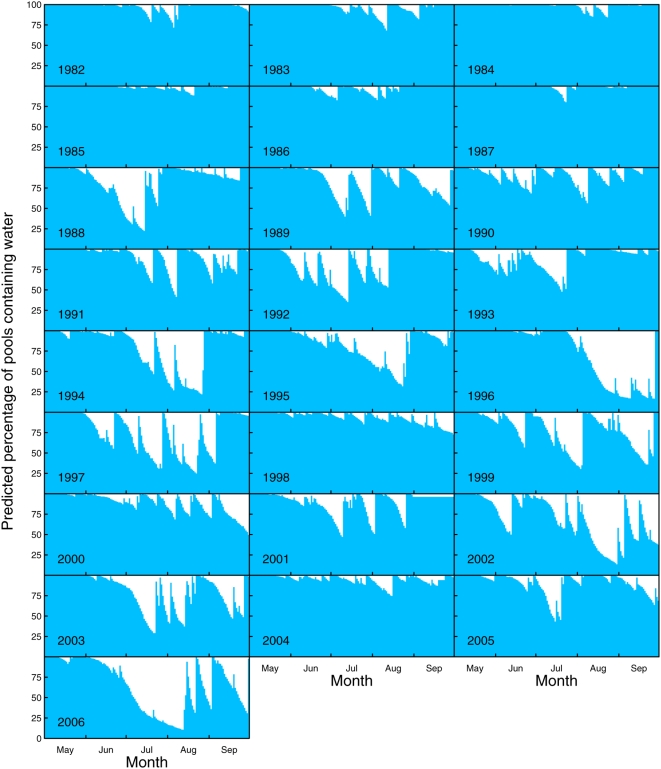
Figure 3. Predicted hydroperiod.
Predicted daily percentage of pools that contained water within the period between 1 May to 30 September for the years 1982 to 2006. The blue area depicts the percentage of all 530 pools containing water at each specific day. In the model, pools were assumed to be brim-full at 1 May. Thereafter, the modelled daily difference between evaporation and influx by precipitation was used to calculate the water level in each pool. Evaporation and desiccation was predicted for each pool individually.

