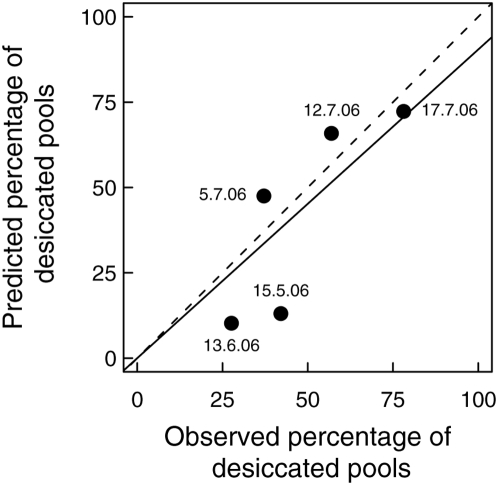
Figure 4. Predicted vs. observed percentage of dry pools.
Observed and predicted percentage of all 530 pools that were dry at five dates during summer 2006. The date of each recording is given. The predicted droughts were in accordance with the observed droughts (Chi 2 = 8.6, df = 4, p = 0.07). The straight line is the least square fit (y = x*0.91; R 2 = 0.89, p = 0.004). The slope of this curve did not differ from the 1∶1 line (dashed).

