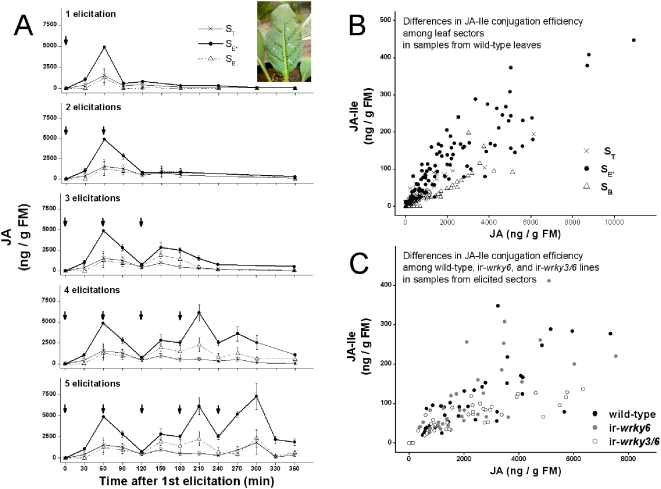
Figure 5. Spatial heterogeneity in JA accumulation and metabolism within an elicited leaf after repeated OS-elicitations.
(A) JA accumulation in the repeatedly elicited laminal sector (SE*, closed circles on thick solid lines) was 3 times the amount in adjacent, non-elicited sectors (SB, open triangles, dot-dash lines; and ST, x's. thin solid lines). Sectors separated from the elicitation site by the mid-rib (SO) rarely accumulated any JA (data not shown). Peaks and troughs in the JA kinetic are less distinct in non-elicited sectors on the elicited side of the midrib. (B) Kinetics of JA-Ile elicitation closely track the JA kinetics after repeated elicitations, but the ratio of JA-Ile to JA from all samples from SB [open triangles, m = 0.0286±0.00138 (S.E.)] was significantly lower than those in SE* [closed circles; 0.0414±0.00199 (S.E.); Student's t-test, P≪0.0001] and ST [x's; 0.0388±0.00217 (S.E.); Student's t-test, P = 0.0001]. (C) Silencing the expression of both NaWRKY3 and NaWRKY6 significantly reduced elicited JA-Ile to JA ratios in elicited laminal sectors [ir-wrky3/6; open circles; m = 0.0187 (S.E.)±0.00258] compared to wild-type plants [closed circles; 0.0381±0.00100 (S.E.); Student's t-test, P≪0.0001] and ir-wrky6 plants [gray circles; 0.04285±0.00729 (S.E.); Student's t-test; P = 0.003]. Arrows indicate time of elicitation (1 per h).

