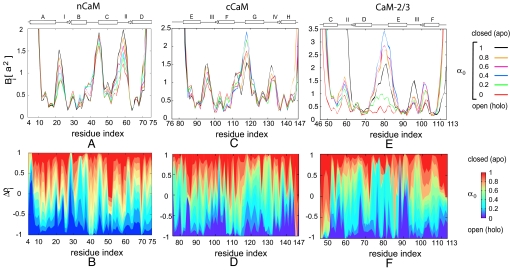
Fig. 2.
Structural characterization of transition routes. (A, C, E) The fluctuations Bi vs. residue index for selected values of the interpolation parameter α0 of nCaM, cCam, and CaM2/3, respectively. Here, a = 3.8 Å is the distance between successive monomers in our model. The secondary structures for nCaM, cCaM, and CaM2/3 are indicated above each plot. Helices are represented by the rectangular boxes, binding loops and helix linker are indicated by lines, and small β-sheets are shown by arrows. (B, D, and F) Difference between the normalized native density Δρi (a measure of structural similarity) vs. residue index for different α0 of nCaM, cCaM, and CaM2/3, respectively. In each plot the change in color from red to blue indicates the progress along the transitin from the apo to holo conformations. This is normalized to be −1 at the holo state minimum(α0 = 0; blue) and 1 at the apo state minimum (α0 = 1; red). (Parts A and B reproduced with permission from S Tripathi and JJ Portman, Journal of Chemical Physics, Vol. 128, page 205104, 2008. Copyright 2008, American Institute of Physics.)

