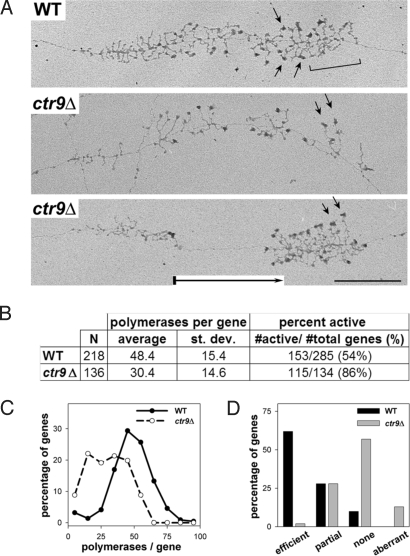
Fig. 5.
EM analysis of Miller chromatin spreads reveals defects in Pol I transcription elongation and rRNA processing. (A) Representative rRNA genes from Miller spreads of WT (NOY396) and ctr9Δ (DAS513) cells. WT rRNA genes showed cleavage of nascent transcripts, indicated by a bracket (Top). Genes from ctr9Δ often exhibited polymerase-free gaps, indicated by a boxed arrow in the gene in Bottom. Arrows indicate uncleaved transcripts. (Scale bar: 0.5 μM.) (B) Quantification of Pol I densities and percentage of active rDNA genes in WT and ctr9Δ strains. Error and size of dataset are indicated. (C) Percentage of genes with different polymerase occupancies is shown for WT and ctr9Δ strains. (D) Cotranscriptional cleavage efficiency was classified into 4 categories (efficient, partial, none, and aberrant) and plotted versus the frequency of detection.

