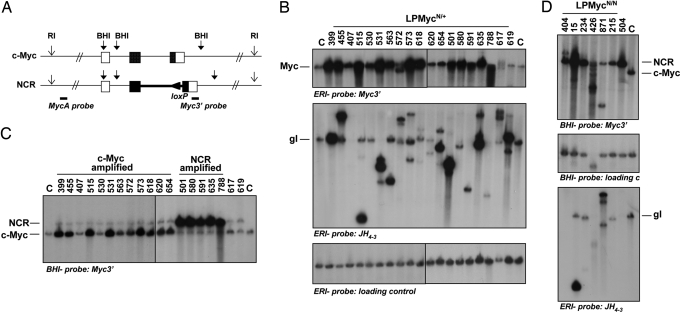
Fig. 2.
The NCR locus is amplified in LPMycN/+ and LPMycN/N tumors. (A) Schematic representation of the endogenous c-Myc and targeted NCR loci. Positions of relevant restriction sites and probes used are shown. (B) Southern blot analysis of LPMycN/+ tumor DNA digested by EcoRI (ERI) restriction enzyme. Probes used are indicated at the bottom of each panel. Positions of the WT c-Myc (Top) and germ-line IgH (Middle) bands are indicated. Loading of an equal amount of DNA in each lane was confirmed by using a control probe (Bottom) hybridizing to the MDC1 gene. (C) Southern blot analysis of LPMycN/+ tumor DNA digested by BamHI (BHI) restriction enzyme and analyzed with Myc 3′ probe. Positions of the WT c-Myc and NCR bands are indicated. (D) Southern blot analysis of LPMycN/N tumor DNA. Restriction enzymes and probes used are indicated at the bottom of each panel. Positions of the WT c-Myc and NCR bands (Top) and germ-line IgH band (Bottom) are indicated.

