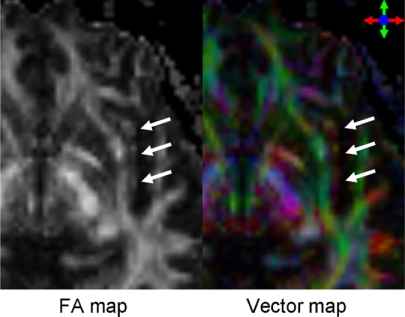
Fig. 1.
The fractional anisotropy (FA) and color-coded vector maps at the level of the basal ganglia. The vector map shows the direction of the local fibers, represented by red (left to right), green (anterior to posterior), and blue (superior to inferior). The location of the EmC is indicated by the arrows.

