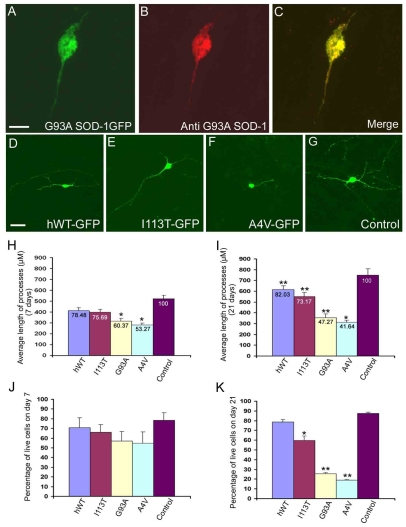
Fig. 2.
Mutant SOD1 alters cell morphology and viability.(A-C) Staining of G93A–GFP-transfected cells with the G93A-specific antibody shows an accumulation of G93A SOD1 cells in the soma and processes at 21 days after transfection.(D-G) Representative fluorescent micrograph of cells transfected with wild-type SOD1, the SOD1 mutants or the control vector after 21 days. (H,I) Average length of neurites on days 7 and 21 after transfection. The values at the top of the bars represent the relative percentage difference between motor neurons transfected with the respective mutants or wild-type SOD1 compared with those expressing the control GFP vector. The length of neurites at 7 days after transfection was reduced by 21.52% (F=3.49, P>0.05) in cells expressing wild-type SOD1, 24.31% (F=6.69, P>0.05) in cells expressing I113T SOD1, 39.63% (F=14.26, P<0.05) in cells expressing G93A SOD1 and by 46.73% (F=11.49, P<0.05) in cells expressing A4V SOD1. (J) Percentage cell survival from day 4 to day 7 after transfection. (K) Percentage cell survival from day 4 to day 21 after transfection; *P<0.05 and **P<0.01 compared with the control. All experiments were executed in triplicate by a blinded observer. Statistical analysis of the percentage of GFP-positive cells compared with wild-type cells shows significant differences with the G93A (F=13.10, P<0.05) and A4V (F=19.18, P<0.01) mutations. Abbreviation: hWT, human wild type. Bars, 10 μm (A-C); 20 μm (D-G).

