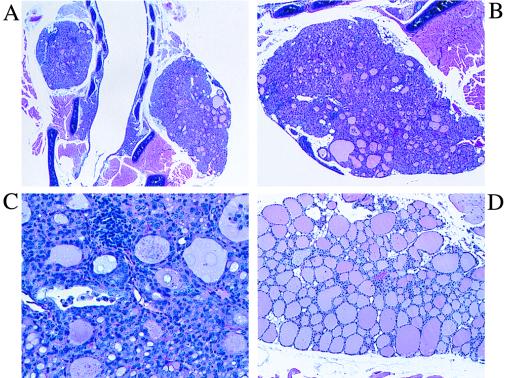
Figure 3.
Histological analysis of the thyroid glands in thyr-IFN-γ transgenic and control mice. Hematoxylin/eosin staining of thyroid glands from line A transgenic mice at ×10 magnification (A), ×20 magnification (B), and ×40 magnification (C). A normal thyroid from C57BL6 mouse is shown for comparison (D).

