Figure 1.
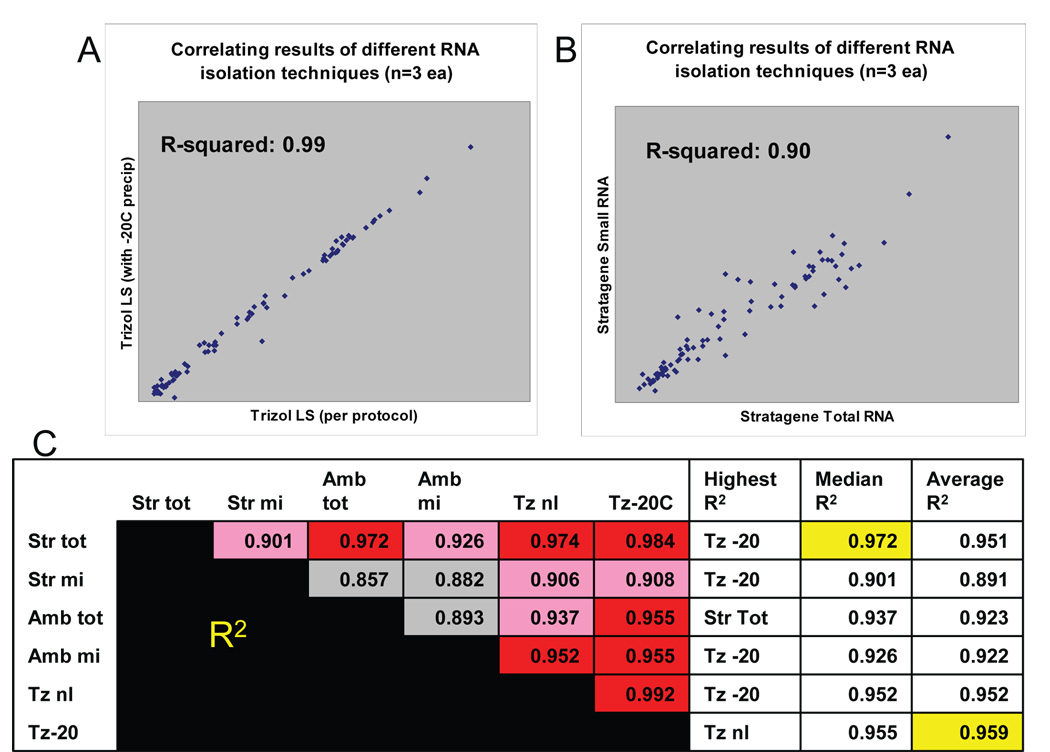
Correlating the results between the six different RNA isolation techniques that are expected to include microRNAs. These comparisons show that distinct RNA isolation methods result in different miRNA profiling results. These data also may help to predict which of the techniques is most able to provide results that correlate with the outcomes of other methods. Correlations were performedusing linear regression in comparing the results of three different microarray experiments (biological replicates). Representative comparisons are depicted in Figs 1A and 1B. . The results of cross-comparisons between all the techniques is presented in Fig 1C. The RNA isolation methods shown here are, respectively, the Stratagene Total RNA, Stratagene small RNA, Ambion Total RNA, Ambion Small RNA, Trizol LS per provided protocol, and Trizol LS with added −20C overnight precipitation step added. For Fig. 1C, each method is compared against each other on the left, using linear regression, in which higher correlation is depicted in red, and lower in gray. For each of the individual RNA isolation methods, the columns to the right of Fig 1C show the method which most closely correlates to that method; the median degree of correlation (R-squared; highest highlighted in yellow); and the average degree of correlation (highest highlighted in yellow). In sum, the overall R-squared are generally >0.90 but the correlations are highest between RNA samples that are designed to obtain total RNA with phenol/chloroform extraction (such as in Fig A). Small RNA isolating techniques show lower degree of correlation, as shown in Fig B.

