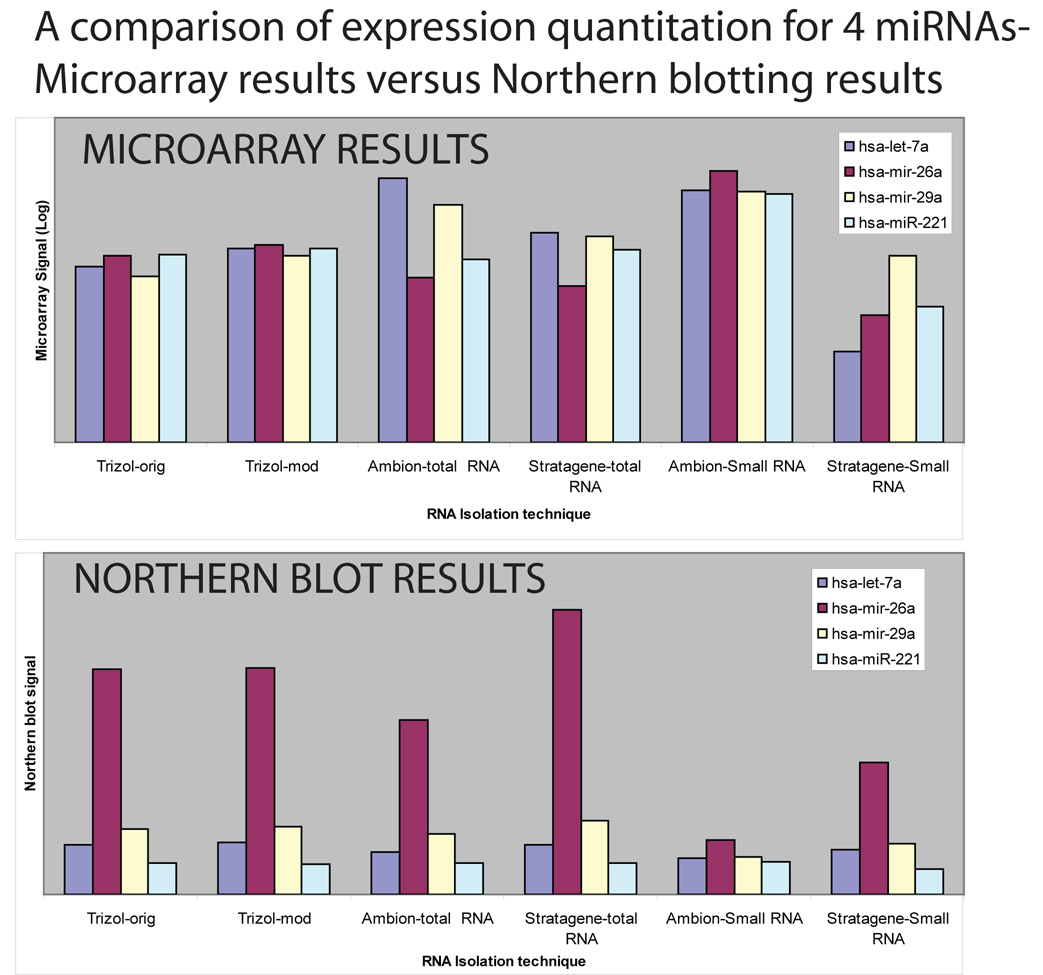
Figure 2.
The microarray and Northern results were not identical, and show that RNA isolation methods will impact differently on different profiling platforms. The top chart is microarray data for miR-26a, miR-29a, Let-7a, and miR-221. The bottom chart relates the data for miRNA expression from the same RNA samples via Northern blot. The microarray and Northern blot data are presented in Supplementary File 5. All the RNA was obtained as technical replicates. The microarray data represents the results of three different microarrays, the Northern blots a single experiment each. Two important differences can be seen relating the microarray results to Northern blots: firstly, the Northern blots appear to be relatively more sensitive for miR-26a, but less sensitive for miR-221 in all cases. Secondly, the overall pattern of expression is similar for between the RNA isolation techniques in the Northern blots. However, for the microarray results, the pattern varied for the different RNA isolation methods, which indicates that for this microarray platform the results are more sensitive (than Northern blots)to the RNA isolation method used.

