
Figure 2.
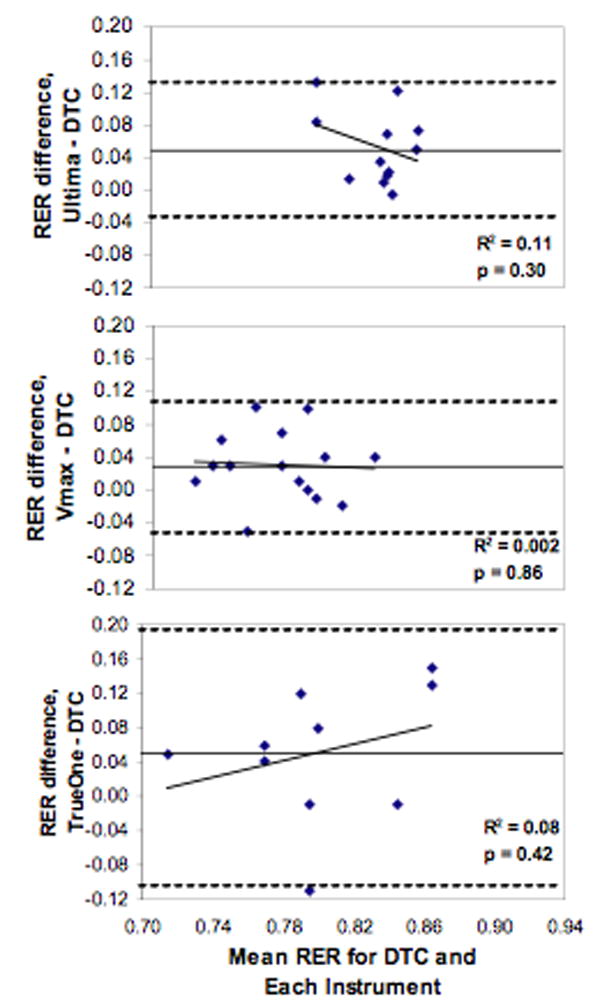
Bland Altman plots of Respiratory Exchange Ratio (RER) for each instrument compared to the DTC. Straight lines represent the average RER difference while dashed lines represent ± 2SD.
Official websites use .gov
A
.gov website belongs to an official
government organization in the United States.
Secure .gov websites use HTTPS
A lock (
) or https:// means you've safely
connected to the .gov website. Share sensitive
information only on official, secure websites.
Bland Altman plots of Respiratory Exchange Ratio (RER) for each instrument compared to the DTC. Straight lines represent the average RER difference while dashed lines represent ± 2SD.