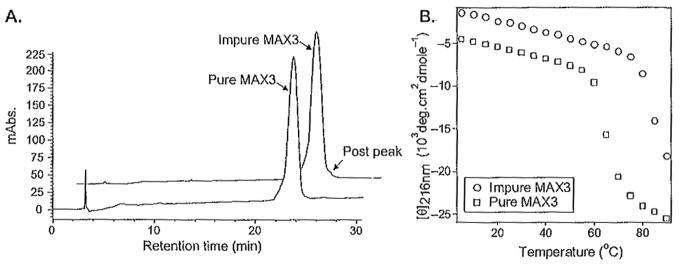
Fig. 4.
(A) Analytical high-performance liquid chfomatographic (HPLC) chromatograms of distinct batches of peptide MAX3. Impure MAX3 has a small postpeak not seen in the pure trace. (B) Temperature-dependant circular dichroism spectra of 150 μM peptide at pH 9.0, 125 mM borate, 10mM NaCl with purity corresponding to the chromatograms in (A). Figure depicts the secondary structure transition from random coil to β-sheet by monitoring the mean residue ellipticity at 216nm as a function of temperature. Impure MAX3 folds and assembles at a higher temperature.

