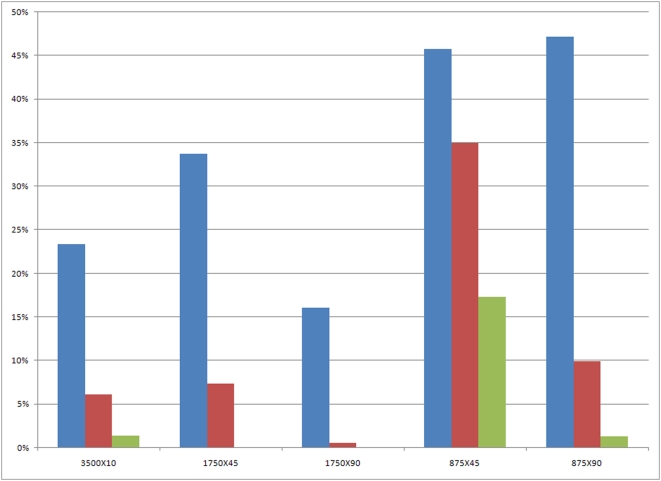
Figure 3. Ablation effect of the sub-layers of the Tunica Media.
Inner most, middle and outer sub-layers are in blue, red and green, respectively. Ablation effect is shown as the percentage of VSMC cells in the sub-layer compared with the same sub-layer in the right carotid artery of the same animal. Note the relative sparing of the inner most VSMC cells in all five groups, compared with the complete ablation of VSMC in the outer layers with 1750 V/cm (second and third groups in the figure).

