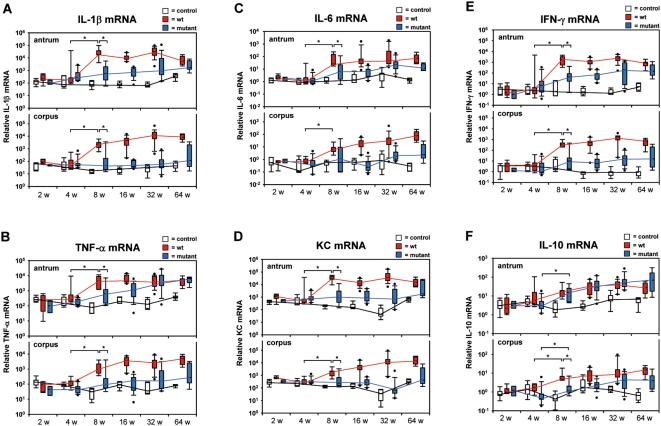
Figure 5. Early inflammatory events are reflected on mRNA level.
(A) IL-1β, (B) TNF-α, (C) IL-6, (D) KC, (E) IFN-γ, and (F) IL-10 mRNA were measured by real-time RT-PCR normalized to 18S ribosomal RNA of antral and corpus mucosa of gerbils orally challenged with H. pylori B128 WT (red box) and B128ΔcagY (blue box) isogenic mutant strain for 2, 4, 8, 16, 32, and 64 weeks compared with age-matched non-infected controls (white box). All box plots show 25th to 75th percentiles (box) and 5th to 95th percentiles (whiskers). Solid dots are outliers below 5% and above 95%. The line in the box represents the median. The interpolated lines connect the medians of the respective time-points. (*p<0.05).

