
Figure 2.
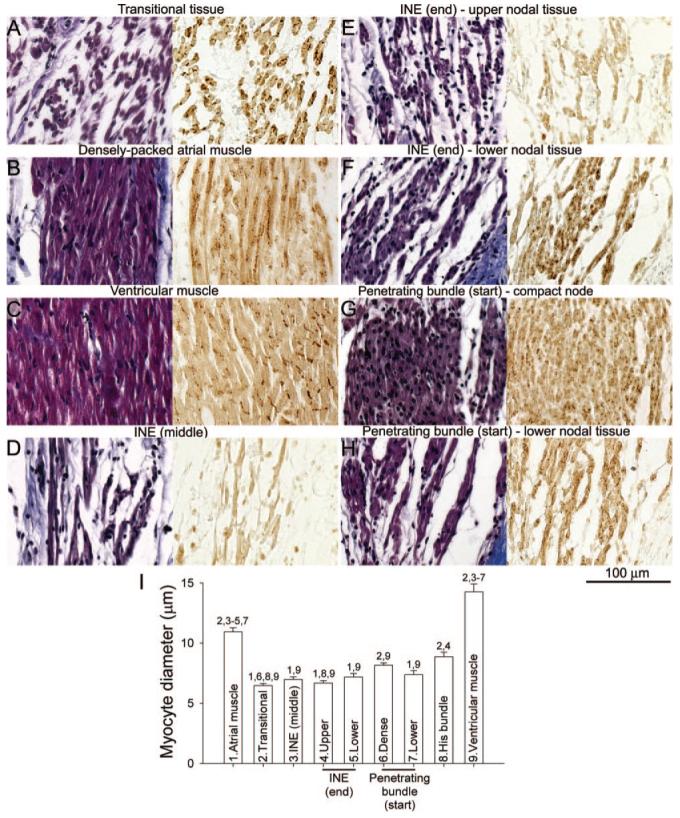
High-magnification images of different myocyte types at atrioventricular conduction axis. A through H, transitional tissue (A), atrial muscle (B), ventricular muscle (C), middle of INE (D), upper nodal tissue of end of INE (E), lower nodal tissue of end of the INE (F), compact node at the start of the penetrating bundle (G), and lower nodal tissue at the start of the penetrating bundle (H). Sections stained with Masson’s trichrome are shown on the left, and adjacent Cx43-labeled sections are shown on the right. A through D were taken from regions a through d in Figure 1D; E and F are from regions e and f in Figure 3A; and G and H are from regions g and h in Figure 3B. I, Mean(+SEM; n=15) diameter of different myocyte types. Numbers 1 to 9 are significantly different (P<0.05; 1-way ANOVA) from the appropriately numbered region.