
Figure 3.
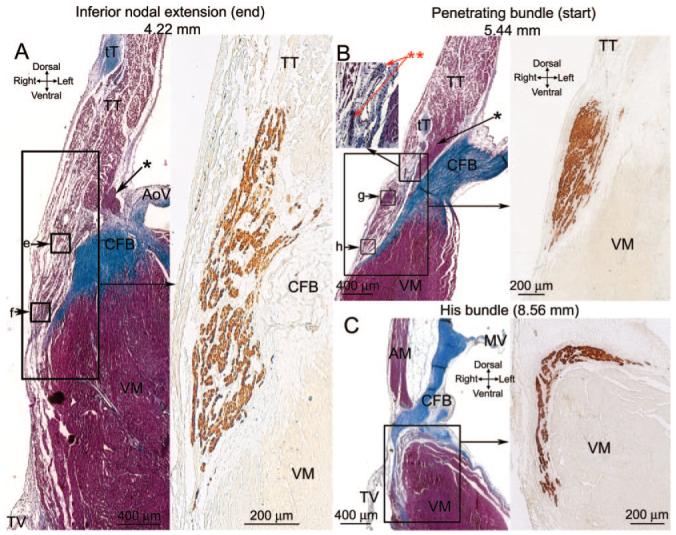
A through C, Sections at the end of the INE (A), start of the penetrating bundle (B), and start of the His bundle (C). Masson’s trichrome-stained sections are shown on the left, and an adjacent neurofilament-labeled section is shown on the right (corresponding to regions shown). Boxes e through h show the location of images in Figure 2E through 2H.