
Figure 7.
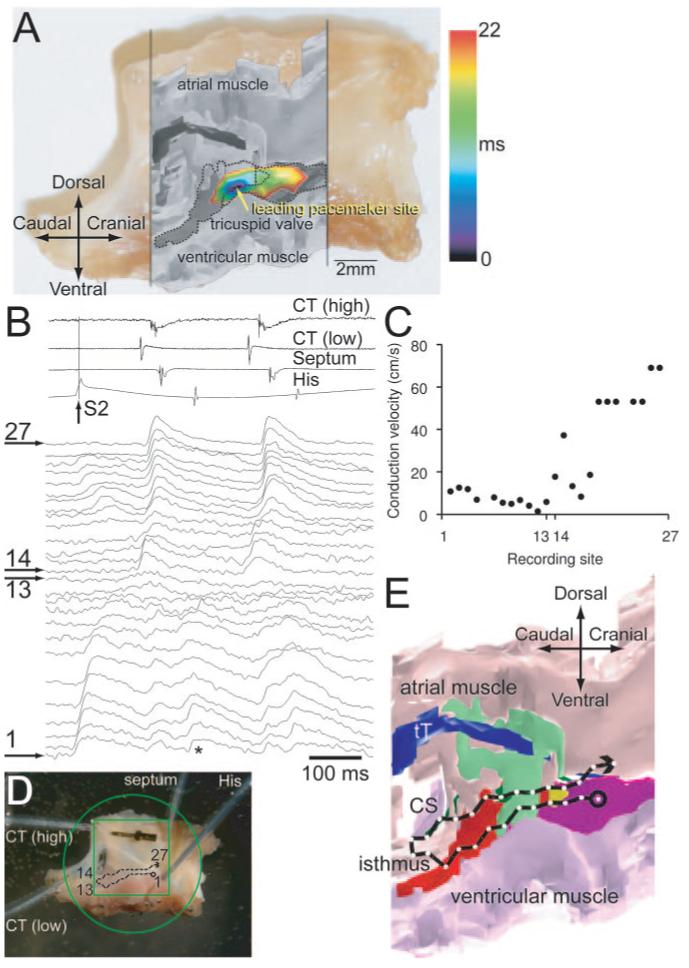
Structure-function relationships of AVN. A, Activation sequence of AVN during pacemaking. The activation map is shown as a color contour map and is superimposed on a grayscale image of model, which, in turn, is superimposed on a photograph of the preparation. B through E, Reentry. B, Extracellular potential recordings from high and low crista terminalis, interatrial septum and His bundle (top), and optical action potentials recorded from sites 1 to 27 shown in D (bottom). S1 and S2 stimuli were applied (S1-S2 interval, 160 ms); only the response to S2 stimulus is shown. C, Conduction velocity along conduction pathway 1 to 27 (calculated from recordings in response to S2 stimulus). D, Position of recording sites 1 to 27 superimposed on a photograph of the preparation. E, Conduction pathway 1 to 27 superimposed on an anatomic model.