
Figure 8.
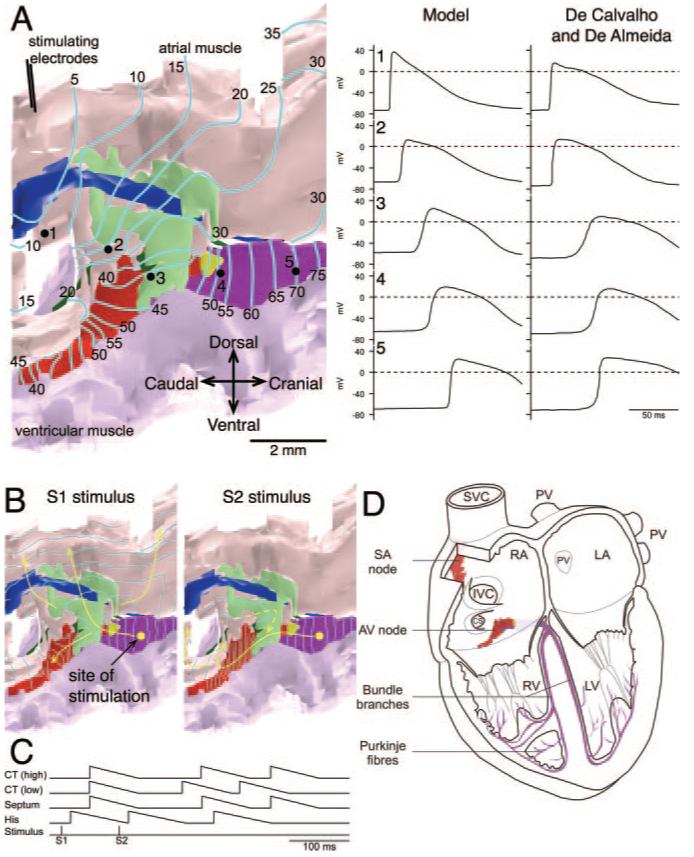
Structure-function relationships of AVN. A, Anterograde conduction as calculated using a monodomain model. Preparation (shown on the left) was stimulated at crista terminalis. The activation sequence is shown as isochrones at 5-ms intervals. Arrows highlight conduction pathway. Calculated intracellular action potentials recorded at sites 1 to 5 (see preparation) and comparable intracellular action potentials recorded experimentally8 are shown on the right. B, Fast-slow reentry as calculated using the cellular automaton model. Preparation was stimulated at the His bundle (yellow spot) using a S1-S2 protocol (S1-S2 interval, 96 ms). The activation sequence (shown as isochrones at 5 ms intervals) in response to S1 and S2 stimuli is shown. Arrows highlight the conduction pathway. C, Timing of stimuli and action potentials (at high and low crista terminalis, interatrial septum, and His bundle) during S1-S2 stimulation (from simulation in B). D, Anatomic models of AVN (nodal tissue only) and SAN4 (central SAN tissue only) superimposed on a 4-chamber view of the heart.