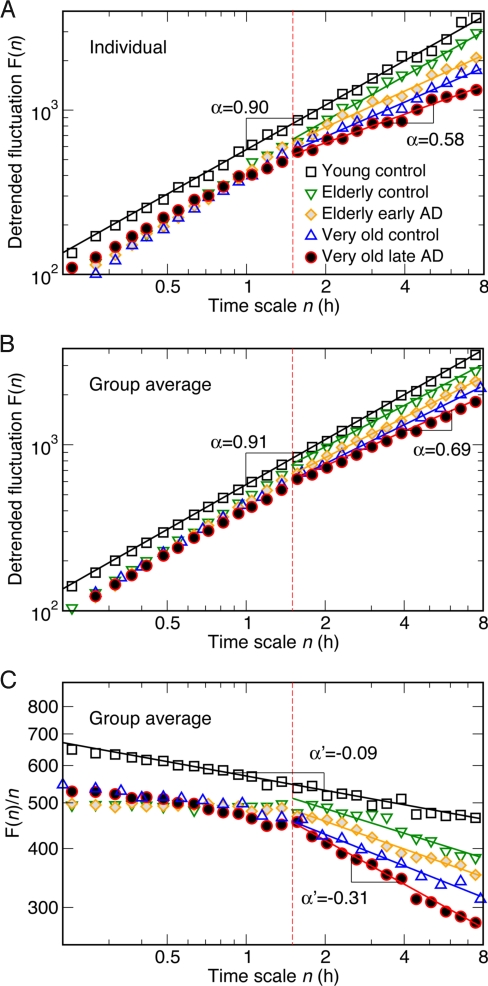
Fig. 2.
Altered scale-invariant correlations of activity fluctuations in elderly and AD subjects. Detrended fluctuation functions were obtained from activity data during the daytime between 11 a.m. and 7 p.m. (A) Representative individuals from each group. (B) Group averages. Data are shown on log–log plots. On the abscissa, n represents the time scale in hours. The detrended fluctuation functions F(n) are vertically shifted for better visualization of differences between groups. F(n) in young controls (squares) exhibits a simple power-law form over the whole range from minutes to 8 h, indicated by a straight line in the log–log plot. In contrast, there is clearly a “break point” in the log–log relationship at a time scale of ≈1.5 h in the elderly controls and in the AD subjects (see dotted vertical lines in each plot, with different scaling behaviors below and above this time scale). (C) The break point can be seen more clearly where group average F(n) divided by time scale n was plotted. The exponent obtained from the power-law fitting of F(n)/n is α′ = α − 1.

