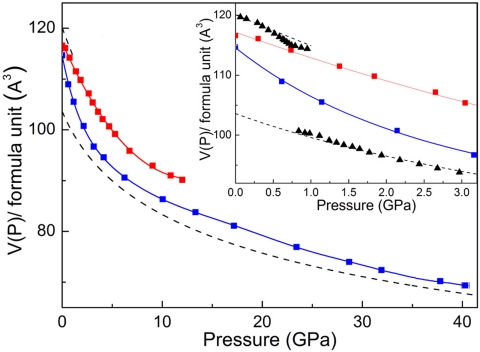
Fig. 4.
P-V relations for Ce3Al up to 40 GPa. The high-pressure volumes of α-Ce3Al (red squares) and fcc alloy (blue squares) were determined in the present study by in situ XRD during pressure increase and release. The dashed curves are (3Vγ-Ce + VAl) and (3Vα-Ce + VAl) at pressures < and >1 GPa, respectively, calculated by using results from the volumes for pure Ce (VCe) (29) and pure Al (VAl) (30). (Inset) Expanded P-V plot up to 3 GPa; recent high-precision data of VCe from ref. 28 were used to calculate the black triangles.

