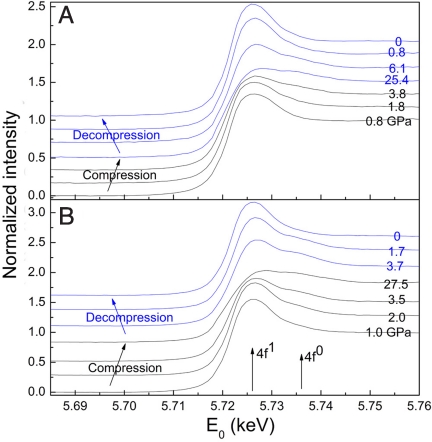
Fig. 5.
In situ XAS spectra of Ce L3-edge with α-Ce3Al compound (A) and Ce3Al metallic glass (B) as the starting materials. Starting phases during compression (black curves), and fcc alloy after conversion and during decompression (blue curves) are shown. The numbers on each pattern denote the pressures, and the arrows point to the 4f0 and 4f1 components. The appearance of the 4f0 feature indicates the delocalization of 4f electron, which coincides with the relatively sharp drop in pressure dependence observed in Ce3Al volume in Fig. 4.

