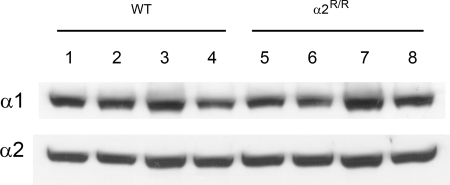
Fig. 1.
Na,K-ATPase α1 and α2 isoform expression in adult skeletal muscle from 4 WT mice (lanes 1–4) and 4 α2R/R mice (lanes 5–8). Three similar blots were obtained and averaged for each isoform from 4 WT and 4 α2R/R mice. There was no significant group effect between genotypes for either α1 (P > 0.23) or α2 (P > 0.14) isoform. α-Isoform expression was measured by Western blot analysis using α1- and α2-specific antibodies, as described previously (20, 37). The α3 Na,K-ATPase isoform is not detected in this preparation (20).

