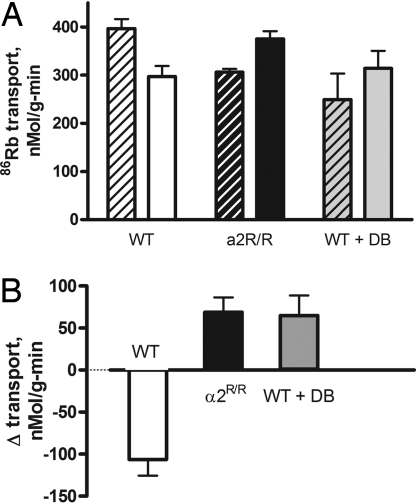
Fig. 4.
Regulation of Na,K-ATPase in the EDL of WT and α2R/R mice at rest and immediately after contraction. (A) Mean total 86Rb uptake at rest (striped bars) and during the first 60 sec after a 30-sec contraction at 90 Hz (solid bars) in WT, α2R/R, and WT infused with Digibind (WT + DB). Resting Rb uptake was 396.5 ± 20.1 (5) in WT, 306.3 ± 6.8 (4) in α2R/R, and 249.1 ± 8.8 (4) in WT + DB. Resting Rb uptake in α2R/R and WT + DB were significantly different from WT, but not significantly different from each other (P = 0.0028; 1-way ANOVA with Tukey's multiple comparison post test). (B) Mean contraction-induced change in 86Rb transport, Δ transport (after contraction–resting), measured in paired (left and right leg) EDL muscles of WT, α2R/R, and WT + DB mice. Δ Transport was −107.3 ± 17.0 (5) in WT, 69.0 ± 17.6 (4) in α2R/R, and 64.9 ± 23.9 (4) in WT + DB. Δ Transport in α2R/R and WT + DB were significantly different from WT, but not significantly different from each other (P = 0.0001; 1-way ANOVA with Tukey's multiple comparison post test). The mean nonspecific 86Rb uptake was 103.3 ± 8.9 (5) in resting muscles and 111.5 ± 7.5 (5) in stimulated muscles. The WT + DB mice were infused with 150–200 ng/g of body weight (equivalent to a plasma concentration of 50–60 nM) via a femoral catheter for 40 min before tissue extraction).

