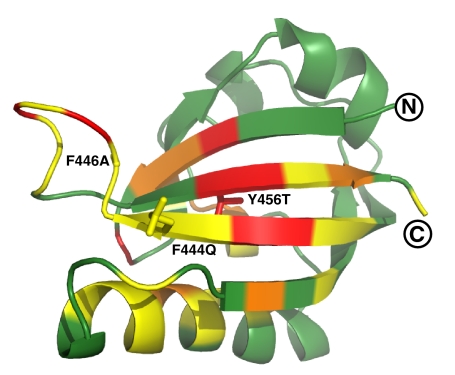
Fig. 4.
Chemical shift changes between conformations of ARNT PAS-B. Ribbon diagram of structure closest to the mean in the ensemble is shown. Changes in chemical shift between the two conformations are color-coded onto the ribbon diagram (green, <0.3 ppm; yellow, 0.3–0.6 ppm; orange, 0.6–0.9 ppm; red, >0.9 ppm). Molecular graphics were generated by using MOLMOL and PyMOL (http://pymol.sourceforge.net/).

