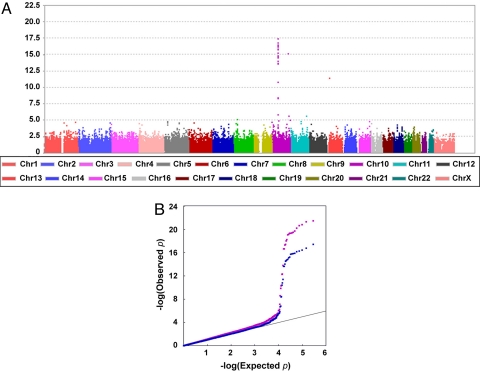
Fig. 1.
Results of the Genomewide Association Study. (A) Cochran-Armitage significance test results after EIGENSTRAT correction for population stratification. (B) Q-Q-plot revealing deviation of association from expected, starting from P = 5 × 10⁻⁴ (purple before and blue after EIGENSTRAT correction).

