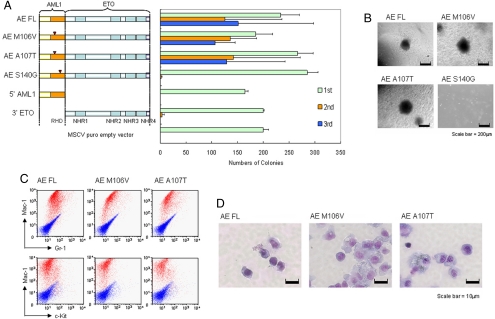
Fig. 2.
Enhanced self-renewal of primary hematopoietic cells by CBFβ interaction-deficient AE point mutants. (A) Left, Schematic diagram indicating the retroviral constructs of AE and the point mutants used in the RTTA. Right, Bar chart represents the corresponding number of colonies in each round of platings. Error bars indicate SD of 3 independent experiments. (B) Typical third-round colony morphology of the indicated retroviral-transduced primary bone marrow cells. (C) Phenotypic analysis of cells transformed by the indicated constructs. Red profiles represent stainings obtained with antibodies specific for the indicated surface markers. Blue profiles show unstained controls. (D) Typical morphology of primary bone marrow cells transduced with indicated constructs after the third plating.

