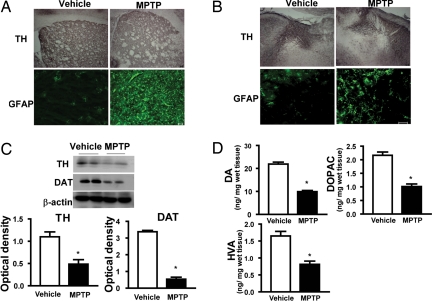
Fig. 1.
Characterization of the subchronic MPTP mouse model of PD. (A and B) Immunohistochemistry for TH and immunofluorescence for GFAP are shown in STR (A) and SN (B). (C) Representative Western blots of TH and DAT proteins). Bar graphs show quantitative data for TH and DAT signals that are normalized to β-actin signal (n = 8–10 per group). (D) Bar graphs show HPLC measurements of DA and metabolites, DOPAC and HVA, after vehicle or MPTP (30 mg/kg per day) treatment (n = 8–10 per group). (Scale bar, 50 μm.) *, P < 0.05 compared with the vehicle-treated group.

