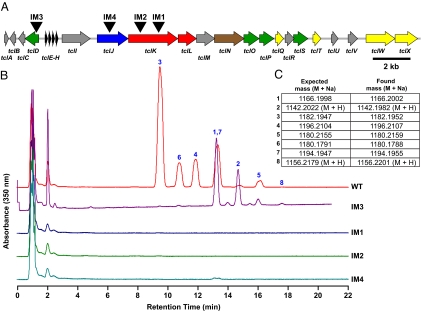
Fig. 2.
Characterization of thiocillins by HPLC and MS. (A) Schematic of the thiocillin gene cluster, showing the plasmid integration sites of insertional mutants IM1, IM2, and IM4, and control strain IM3. (B) HPLC stack plot showing methanolic extracts of cell material from cultures of B. cereus ATCC 14579, insertional mutants IM1, IM2, IM4, and control strain IM3. Peaks corresponding to compounds 1–8 are labeled. Thiocillin production is abolished in the insertional mutants, whereas in IM3, flux is shifted toward the nonhydroxylated thiocillins 1, 2, 5, and 8. (C) High-resolution MS data for compounds 1–8.

