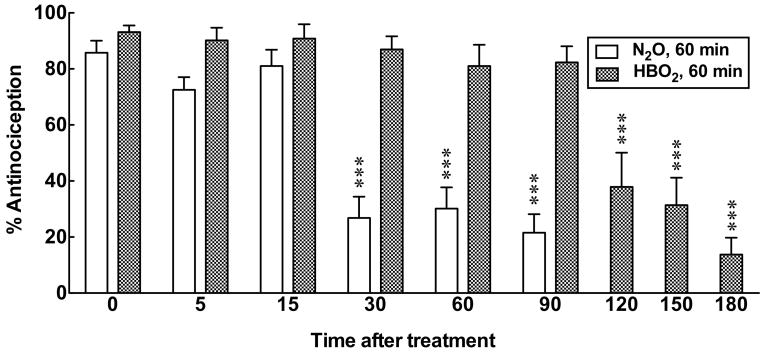
Fig. 1.
A comparison of the duration of HBO2- versus N2O-induced antinociceptive effects. Each bar represents the mean percent of antinociceptive response ± S.E.M. of 8–12 mice per group. Significance of difference: ***, p < 0.001, compared to the 0 time N2O or HBO2 control group (post-hoc Bonferroni test).

