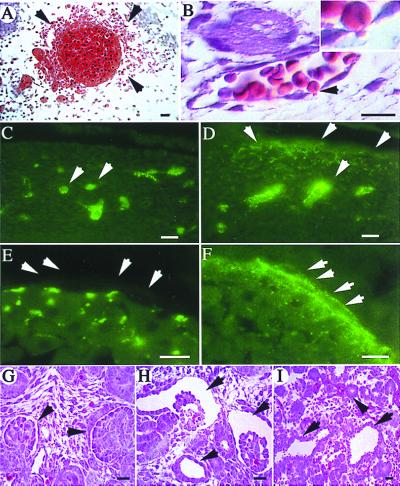
Figure 3.
Histological analysis of tissues from Pkd1L/L embryos. (A) Hematoxylin and eosin stain showing red blood cells (arrowheads) outside a blood vessel in the neck region at E13.5. (B) A skin capillary at E13.5 from a region not showing gross hemorrhage. A red blood cell (arrowhead and Inset) is seen traversing the endothelial cell lining between two adjacent cells. (C–F) Tissue sections revealing the leak of intravascularly injected fluorescent dextran into the extravascular interstitium (D, arrows) at distant sites in a E12.5 PkdL/L embryo (D and F). In the age-matched WT (C and E), dextran is retained within the vasculature (arrows). No fluorescence is seen on the basolateral side of the lining endothelium in WT embryos (E, arrows). In contrast, fluorescent dextran is seen basolaterally (F, arrows) and at intercellular junctions in the mutant. (G–I) Hematoxylin and eosin stain of a section of a normal developing kidney at E14.5 (G), showing two normal glomeruli (arrowheads). An age-matched PkdL/L kidney (H) shows two large glomerular cysts (arrows), and a tubular cyst (arrowhead). (I) A section of a pancreas from this PkdL/L embryo shows two tubular cysts (arrows) adjacent to normal-sized ducts (arrowhead). Sections shown in A, B, G, H, and I are 5 μm thick, and those in C–F are 4 μm thick. (Scale bars = 10 μm, except in E and F where the scale bar = 5 μm.)

