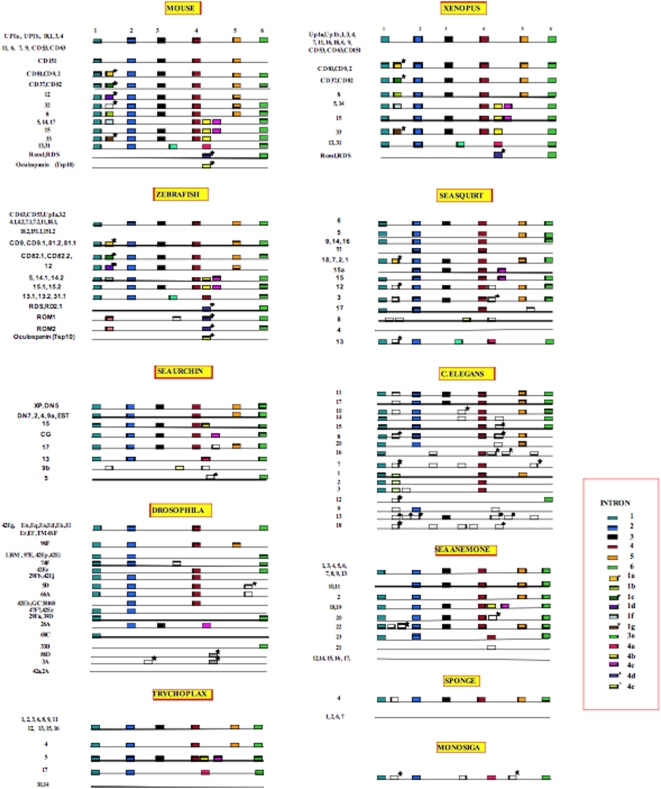
Figure 2. Intron/exon structure of all animal tetraspanins in the present study.
Intron positions are represented by boxes of different colors. Ancestral introns 1–6 are numbered on top of the figure. Same color boxes represent conserved intron position. Empty boxes indicate unique intron positions within the species gathered in this analysis. A star above a box indicates an intron position that breaks the reading frame (intron phases 1 or 2).

