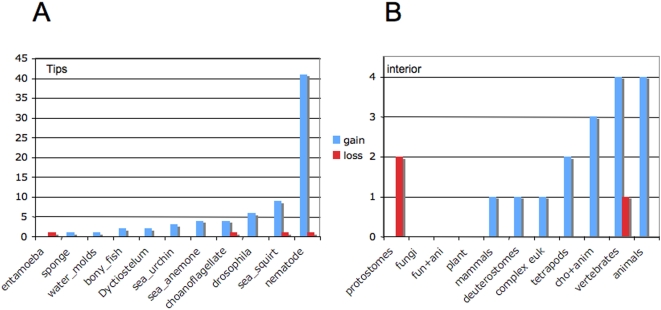
Figure 6. Histogram showing a comparison of the number of introns in taxa that are gains and losses at the tips of the tree (A) and at internal nodes of the tree (B).
The number of events was calculated using the ACCTRANS option in MacClade. Common names of the species and higher categories of organisms are given on the X axis. The number of intron gains and losses are given on the Y axis. Gains are in blue. Losses are in red.

