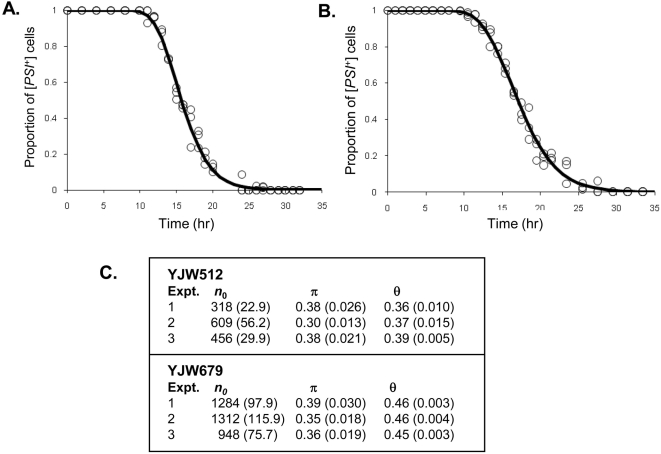
Figure 3. Observed proportion of [PSI +] cells and fitted curve of p+(t).
One set of data for each of the [PSI +] strains (A) YJW512 and (B) YJW679 is shown. The curing parameter estimates for three independent experiments (1, 2, and 3) with 3 mM of GdnHCl are given in the table (C) with the values in brackets being the estimated standard errors for each parameter. Panels A and B represent one experiment while two other sets of data independently generated for these two strains are provided in Figure S1.

