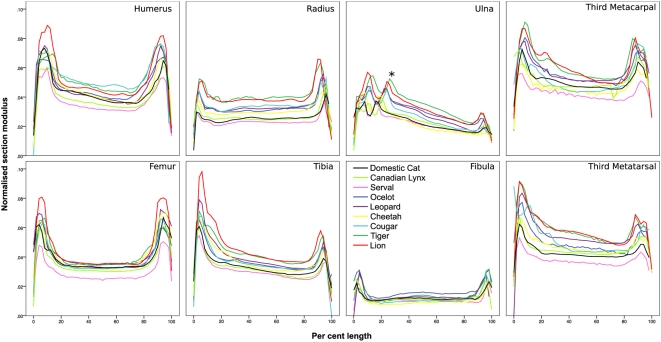
Figure 2. Normalised section modulus versus per cent length.
Normalised section modulus (Z max 1/3 / length) versus per cent length (proximal = 0%) for appendicular long bones. Contributions from multiple individuals within species have been averaged. Note the characteristic profile of each bone, a tendency for epiphyses to have markedly larger normalised section moduli than diaphyses and that larger felids tend to have larger normalised section moduli at all per cent lengths than smaller felids in all bones except the fibula. Coronoid process (*). See Figure 3E for reference bones.

