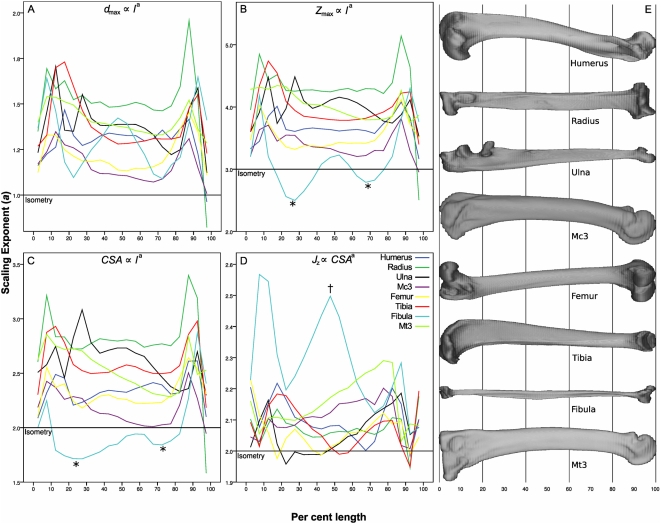
Figure 3. Scaling exponent (a) versus per cent length.
Scaling exponents (a) were calculated for 5% length bins for each bone (0% is most proximal) for the following allometric relationships: (A) d max ∝ l a; (B) Z max ∝ l a; (C) CSA ∝ l a; (D) J z ∝ CSA a. The isometric exponent is indicated by a horizontal line in each plot. Wide variation is evident in scaling exponents both between and within bones. Scaling exponents tend to be greater at the epiphyses that at 50% length, and in the fibula the proximal and distal thirds (*) scale less strongly than the midshaft (†). (E) Panthera pardus (leopard) bones scaled to 100% length for reference.

