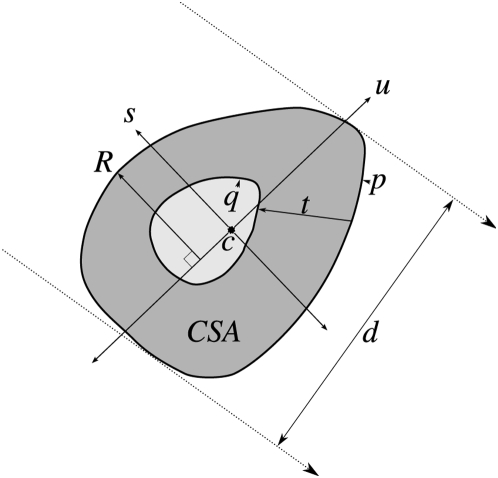
Figure 5. Slice measurements.
The following calculations were made with an ImageJ macro for each CT slice after thresholding for cortical bone: centroid (c), major and minor principal axes (u, s) and the moments of inertia around them (I min, I max); outer and inner perimeters (p, q) were found; cortical thickness (t) was the distance from each point in p to the nearest point in q; cross-sectional area (CSA) was the number of thresholded pixels multiplied by pixel area; the greatest distance from each principal axis (R) was found for the calculation of Z max and Z min; diameter (d) was the distance between two parallel lines of support as per the rotating calliper method. Equations are detailed in supplementary material (Text S2).

