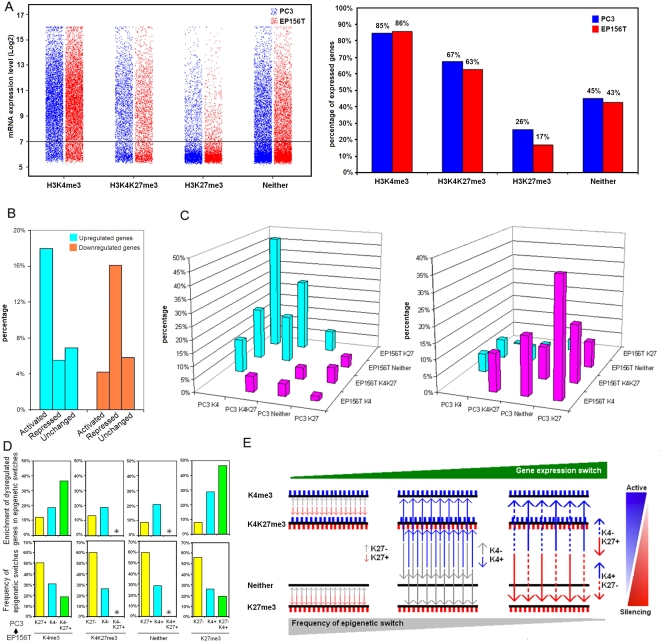
Figure 3. Correlation of H3K4me3 or H3K27me3 Marks with Gene Expression Levels in Prostate Cells.
A. Expression levels of genes with different epigenetic marks. The expression levels of individual genes were plotted (left). Percentages of expressed genes in each category are shown (right) with the threshold of mRNA expression set to 7 in J-Express. B. Enrichment of up- or downregulated genes in PC3 compared with EP156T cells within epigenetically repressed, activated and unchanged groups. C. Enrichment of up- (left) or downregulated (right) genes in PC3 compared with EP156T cells in different epigenetic changes. Blue means epigenetically activated and red means epigenetically repressed changes from EP156T to PC3. D. The frequency of epigenetic switches as indicated from EP156T cells to PC3 cells (arrow) shown below and the corresponding enrichment of dysregulated genes in PC3 compared with EP156T cells shown above. Asterisks indicate that switches between Neither and bivalent K4K27me3 were omitted because of too few overlapping genes and low enrichment of dysregulated genes. E. Schematic model to show inverse relationship between the frequency of different combinations of epigenetic switches in primary and cancer cells and the enrichment of dysregulated genes in the different categories of epigenetic changes as depicted graphically in D.

