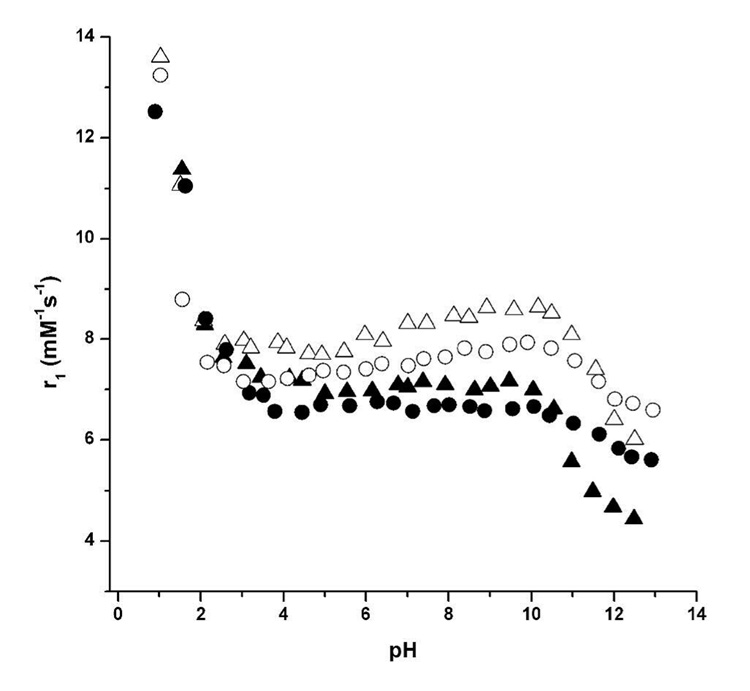
Figure 3.
The millimolar relaxivities (r1, mM−1s−1) of complexes 1–4 plotted against pH. Values were measured at 60 MHz and 37 °C. The contrast agents are represented as: 1 (closed triangles), 2 (open triangles), 3 (closed circles), and 4 (open circles). Comparison of the closed data points allows correlation of the two DOTA-based ligands. Comparison of the open data points allows correlation of the two DTPA-based ligands.

