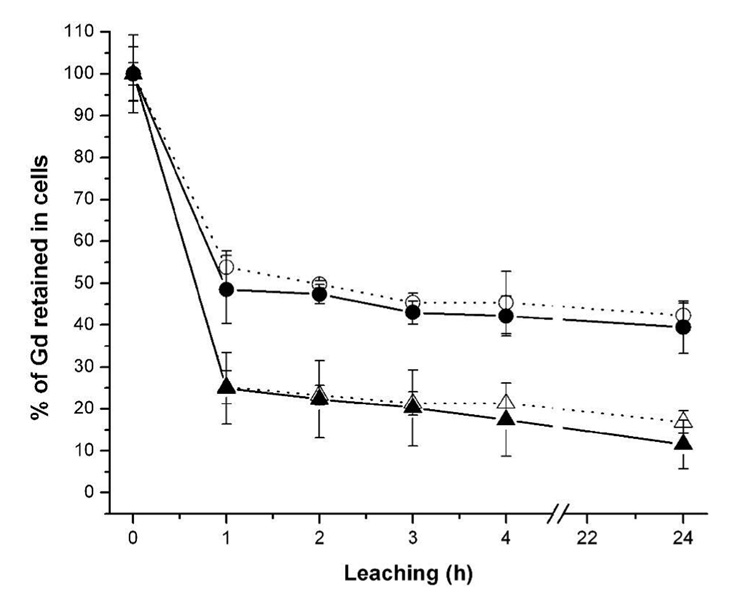
Figure 4.
The percentage of Gd(III) associated with the NIH/3T3 cells as a function of the initial uptake concentration (data taken directly from Supporting Table S1). Cells were washed with DPBS at each time point displayed. The contrast agents are represented as: 1 (closed triangles), 2 (open triangles), 3 (closed circles), and 4 (open circles). Comparison of the closed data points allows correlation of the two DOTA-based ligands. Comparison of the open data points allows correlation of the two DTPA-based ligands.

