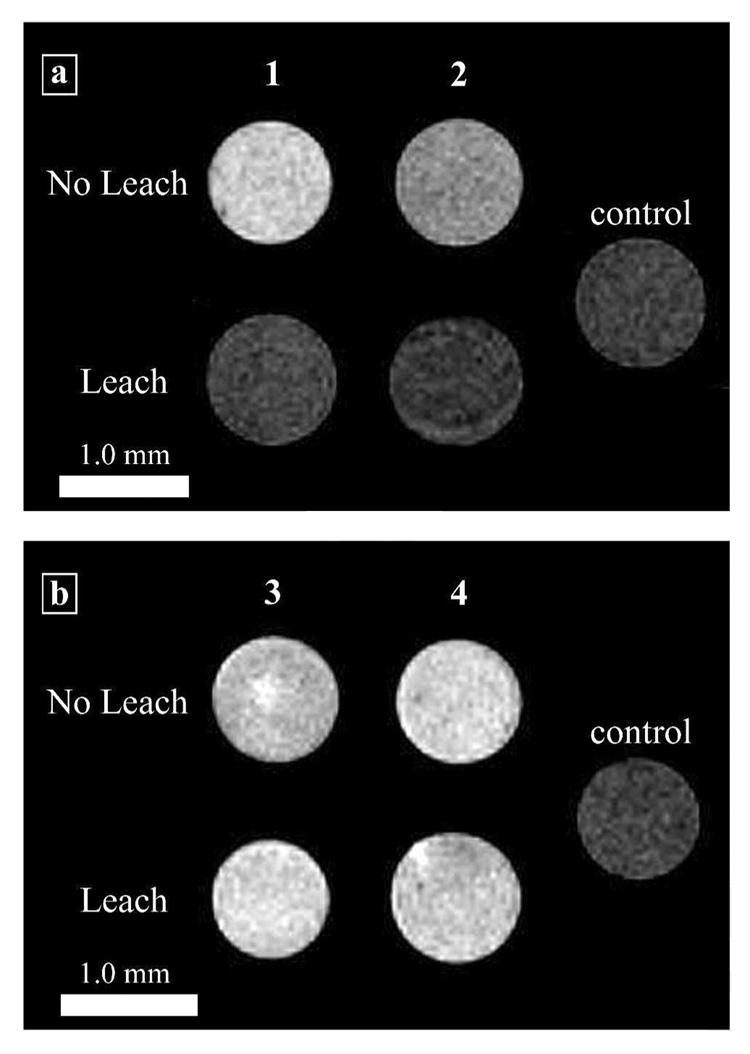
Figure 6.
T1-weighted MR images of NIH/3T3 cells incubated with complexes 1–4. The ‘No Leach’ rows are the cell populations that were not allowed to leach. The ‘Leach’ rows are the cell populations that were allowed to leach for 4 h with washes of DPBS at the hours. The control cells were not incubated with contrast agent but were harvested and packed following the same procedure. (a) Cells incubated with Gd(III)-DOTA-Arg8 or Gd(III)-DTPA-Arg8 (1 and 2). (b) Cells incubated with Gd(III)-DOTA-SS-Arg8 or Gd(III)-DTPA-SS-Arg8 (3 and 4). Images were acquired at 14.1 T with a FOV of 10 × 10 mm (matrix size 256 × 256) and a slice thickness of 1.0 mm. The scale bar represents 1.0 mm. T1 values and student t-tests confirming statistically significant differences can be found in Supporting Table S2.

