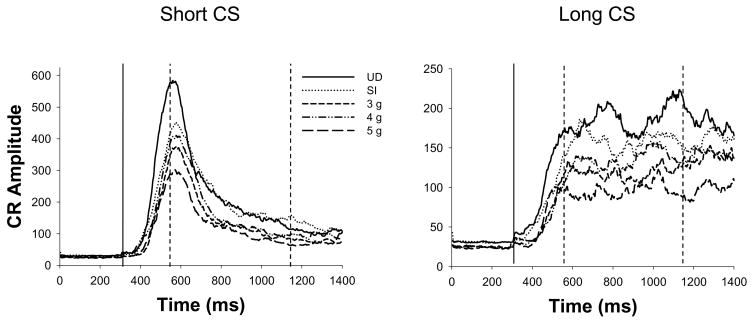
Figure 3.
Tracings of integrated EMG activity averaged across all short- (280 ms CS-US interval; left) and long-CS-alone probe trials (880 ms CS-US interval; right) following session 12. The solid vertical line represents the onset of the CS, and the two dashed vertical lines represent the onset of the short and long US (time expressed in ms). Note differences in scaling across graphs. CR amplitudes are diminished in alcohol-exposed subjects (3g, 4g, and 5g) relative to controls (UD and SI). However, the timing of the CR does not appear to differ as a function of neonatal treatment. CRs for the short CS (left) peak precisely at the point of US onset (280 ms after CS onset), while CRs for the long CS demonstrate an early peak that appears to correspond to the short US onset, and a second peak that occurs closer to US onset for the long CS (880 ms after CS onset).

