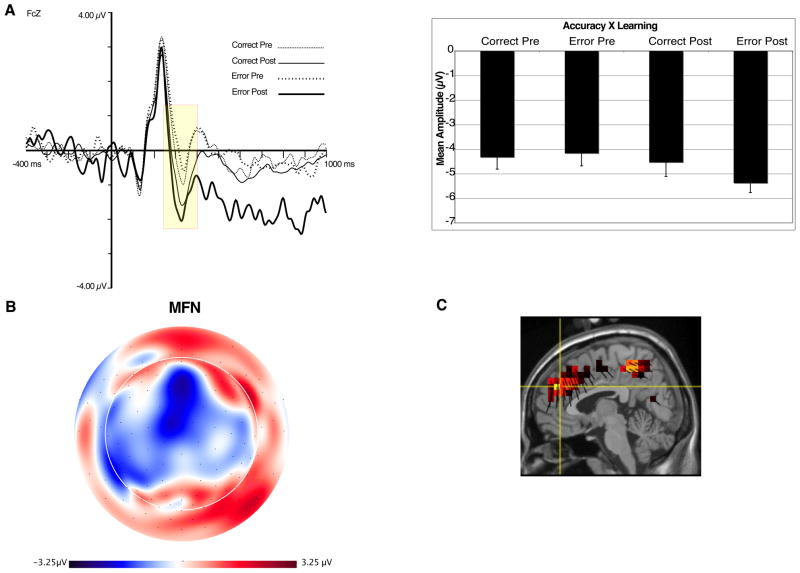
Figure 3.
A. ERP waveforms at site FCz (left). Yellow box represents time window used for quantification of the MFN. Accuracy × Learning interaction for MFN (right). B. Topographic map of difference between post- and pre-error trials, at 300 ms. Orientation of map is top looking down with nose at top of page. C. Source distribution for MFN, also at 300 ms.

