Figure 7.
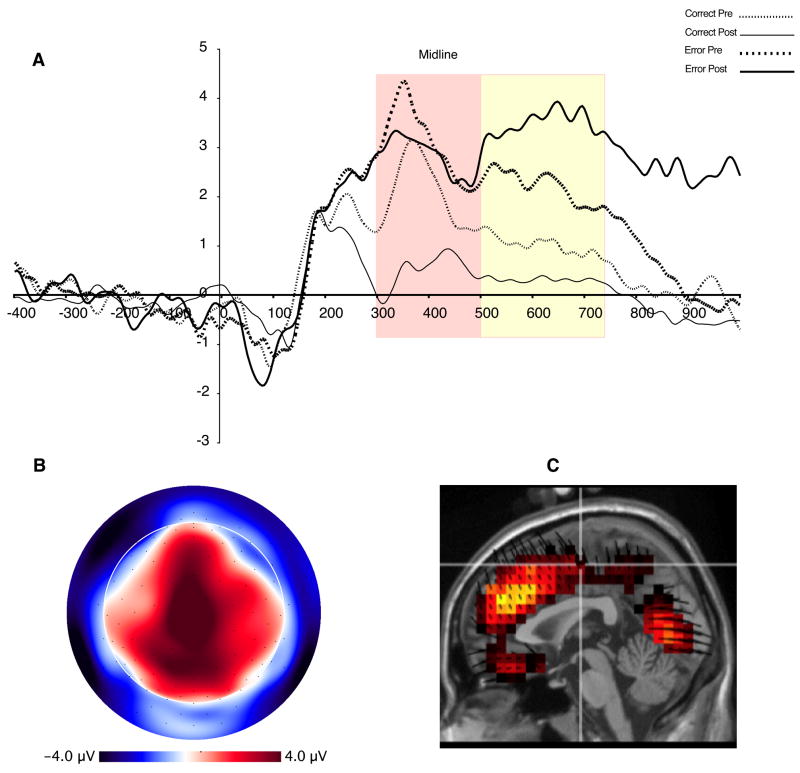
ERP waveforms for feedback-locked P3 averaged over medioparietal sites (see Figure 3). Red and yellow boxes represent time window used for quantification of P31 and P2, respectively. B. Topographic map illustrating P32 distribution at 680 ms. Orientation of map is top looking down with nose at top of page. C. Source distribution for P3s, also at 680 ms.

