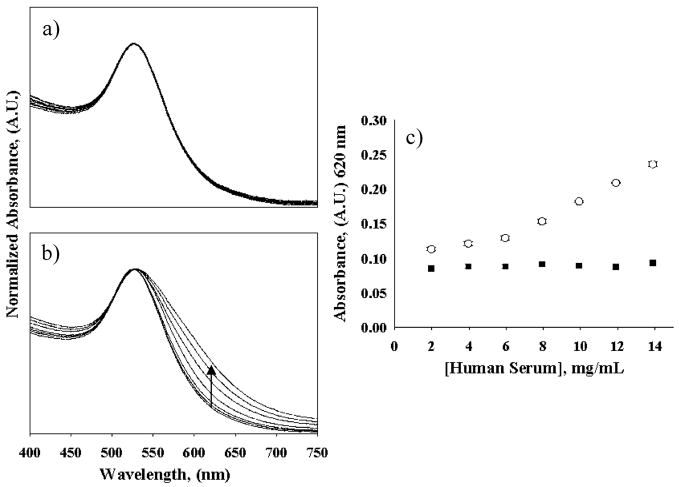
Figure 4.
Visible absorption spectra of the GNP sensor in response to human sera: (a) in the presence of unmodified human sera and (b) in the presence of human serum homocystamide. (c) Sensor response at 620 nm in the presence of modified (○) and unmodified (■) sera versus human serum concentration (2–14 mg/mL). The arrow indicates the change in signal at 620 nm with increasing concentrations of human serum homocystamide.

