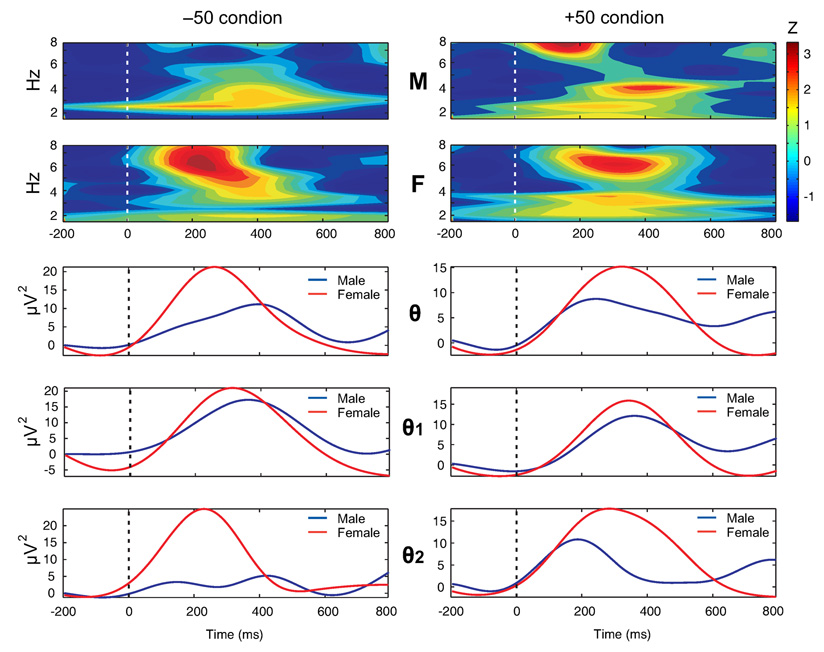
Figure 2.
The time-frequency plots (top 2 rows) and the power-curves obtained from amplitude envelope (bottom 3 rows) for theta bands during −50 (left column) and +50 (right column) conditions at FCZ electrode in male (M) and female (F) groups are shown. The female group had relatively more power in all theta bands. Time (in ms) is represented on the X-axis while power (in µV2) is represented on the Y-axis of the power curves. The color scale (top right) represents power in Z-score. The z-scores were calculated at each frequency (1.0 Hz width) for the epoch length of 1000 ms (200 ms prestimulus plus 800 ms poststimulus). The dashed line represents the onset of an outcome stimulus.

