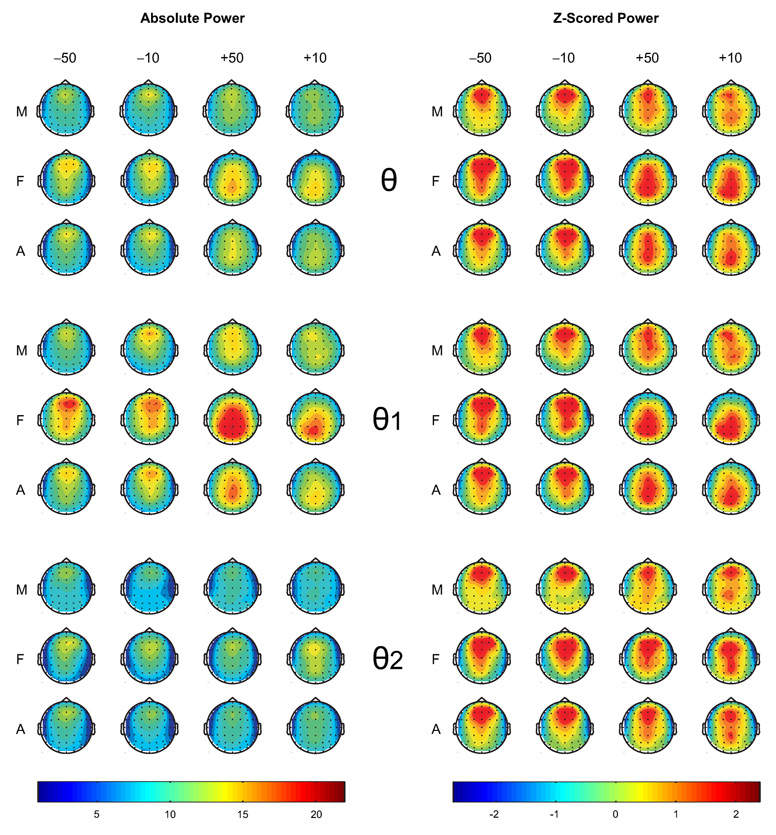
Figure 3.
The topographic maps on the left side show absolute theta power (in µV2) and those on the right side are based on the power values that were z-scored within each map for theta power and its subbands. The power values between 200–500 ms during different outcomes (−50, −10, +50, and +10) in males (M), females (F), and all subjects (A) are shown. Females, as compared to males, produced more theta power in each condition in general, and more posterior activity during gain conditions.

