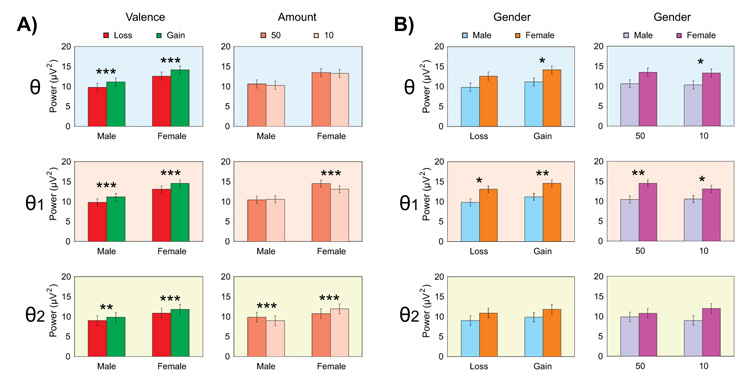
Figure 5.
The bar graphs show the least squares means of the Gender × Valence and Gender × Amount interactions for the within-group (panel-set A) and between-group (panel-set B) comparisons. The significant differences are marked with asterisks (*p < 0.05, **p < 0.01, and ***p < 0.001). The error bars represent 1 Standard Error.

