Figure 1.
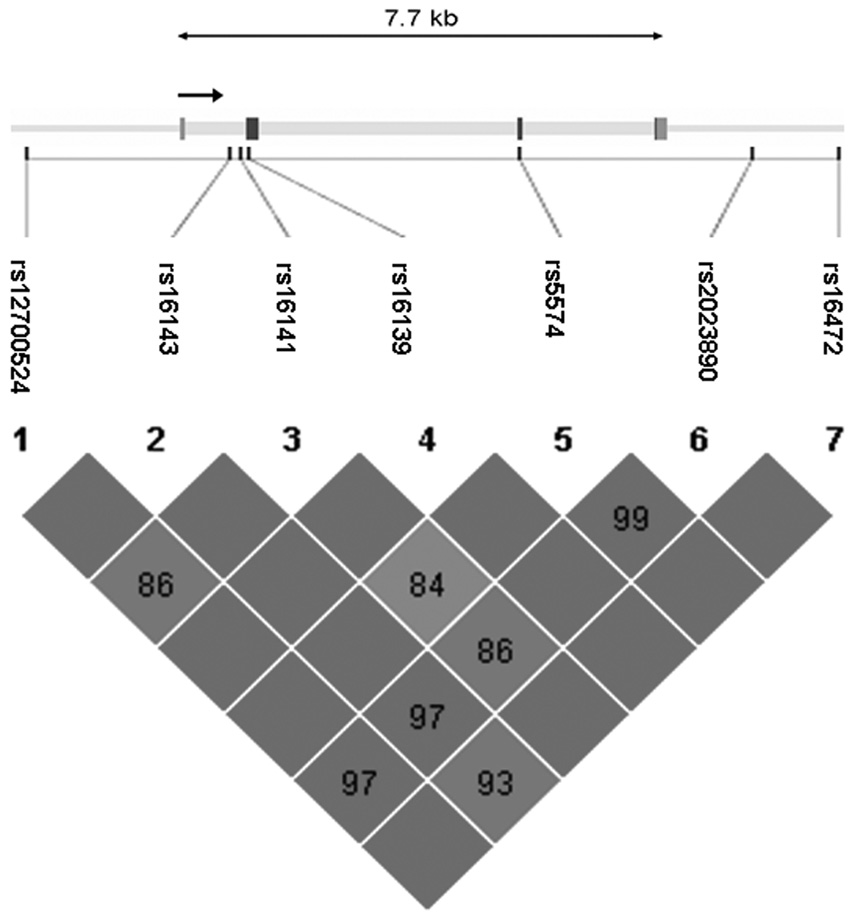
Figure 1A Genomic structure of NPY. The direction of transcription and the exons are indicated in arrow and rectangular block, respectively. Pairwise linkage disequilibrium (LD) estimates, genotyped in the COGA sample, is given as D’. Darkly shaded boxes have strong evidence of LD, defined as a pair of SNPs with the 1-sided upper 95% confidence bound on D’ of 0.98 and the lower bound above 0.70. Lightly shaded boxes have lower LD.
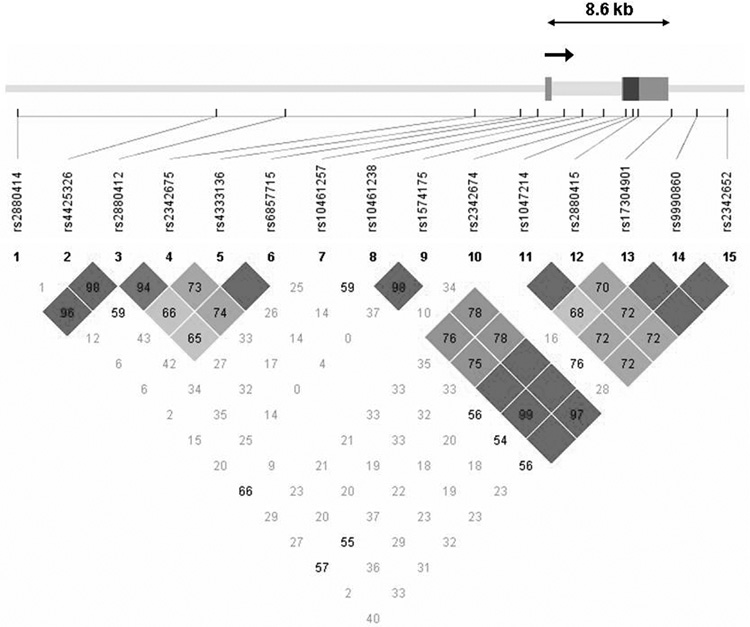
Figure 1B Genomic structure of NPY2R. The direction of transcription and the exons are indicated in arrow and rectangular block, respectively. Pairwise linkage disequilibrium (LD) estimates, genotyped in the COGA sample, is given as D’. Symbols as in Figure 1A.
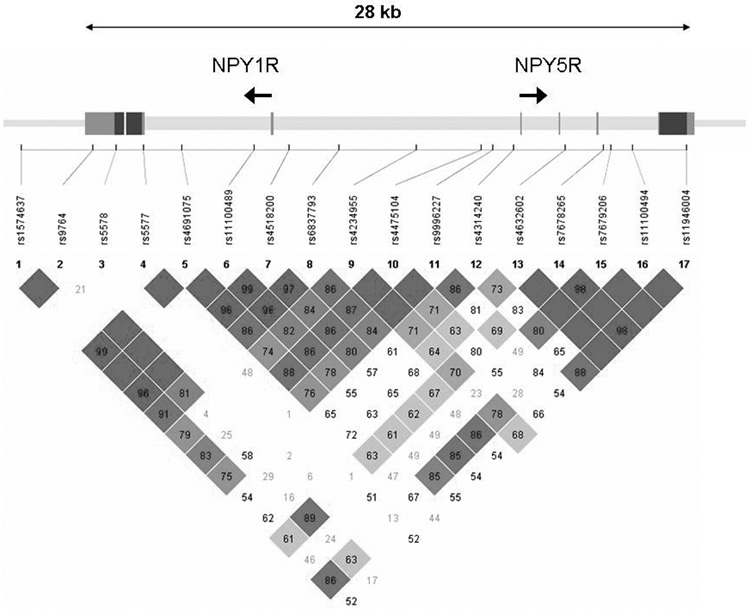
Figure 1C Genomic structure of NPY1R/NPY5R. The direction of transcription and the exons are indicated in arrow and rectangular block, respectively. Pairwise linkage disequilibrium (LD) estimates, genotyped in the COGA sample, is given as D’. Symbols as in Figure 1A


